The following is adapted and printed with permission by Dr. Genevieve Briand from her working paper “COVID-19 Deaths A Look at U.S. Data FEB 2021”
The objective of this analysis is not to produce an “excess deaths number estimate”, but to assess whether the total deaths number the U.S. experienced in 2020 was unexpected or alarming. The data presented in this paper are not estimates—they are records of past deaths, maintained and made publicly available by the CDC. They have not been produced, adjusted, nor tampered with, in any way, by the author.
Graph 2: U.S. All Cause Weekly Deaths per Season, 2014-15 to 2019-20


Can you read from Graph 2 that the All Cause deaths number in 2019-20 was 9.2% higher than in 2018-19? With a little bit of time, you could. Now, most importantly, can you read from Graph 2 that the death rate for season 2019-20 was 0.9%? No, you cannot. Because a death rate is a deaths number, in proportion of its population level, and you are missing a key piece of information—the 2019-20 population level. Note, a death rate of 0.9% is a usual death rate, one that has been experienced in recent years.
All Cause deaths are the actual number of dead bodies accounted for at one point in time and no dead body is double counted.
The way the CDC and NCHS report deaths, as a rate, or proportion of a population, instead of, a number of deaths, makes a lot of sense. A number of deaths by itself is meaningless. For example, is 500,000 deaths an alarmingly high number of deaths? Well, it depends. If it is 500,000 deaths over a year, for a population that, at the beginning of the year, had 1 million individuals, then it would mean half of the population died. But if it is 500,000 deaths over a year, for a population, that, at the beginning of the year, was 100 times that (50 million individuals) then, it would mean 1% (1 per 100) of the population passed away that year.
The first thing to notice is that the U.S. population has not decreased during calendar year 2020 (Table 7). In other words, COVID-19 deaths have not decimated the U.S. population. Instead, in 2020, the U.S. population increased by 0.5 percent over the previous year—just like it did for the two years prior to that. It is the fact that the US population has increased over the years, that explains the increase of deaths numbers over the years. The more people, the more of them pass away. The change in population over the years is the reason why the relevant statistics, to assess whether deaths experienced in 2020 were unexpected or alarming, are death rates. A death rate is a deaths number in proportion to its population level. A death rate does account for the increase in population over the years.

Table 7 shows a change of +529,894 deaths from calendar year 2019 to calendar year 2020, given the level and change in population over the same periods, those deaths numbers are normal—as the respective death rates of 0.9% and 1.0% show.
The death rates show that the total deaths increase experienced in 2020 was not unexpected, nor alarming, but rather, is explained by the population increase.
Note, this result, in conjunction with the facts that (1) every recorded death is allocated one exclusive cause, (2) a new cause was especially created for COVID-19 and, (3) means to test and record COVID-19 deaths were considerably expanded, points to suspicions that some reclassification between other causes of death and COVID-19 deaths might have occurred. Also, note, it is not assumed, or even suggested, that such re-classification, if they occurred, were malicious or intended to inflate COVID-19 numbers. Nonetheless, individuals within organizations do respond to financial incentives and groupthink, to some extent. Similarly, it is not assumed, or even suggested, that mitigation measures adopted were designed to harm targeted groups of the U.S. population. Nonetheless, the unequal toll that those measures have had on individuals across our society cannot be ignored.
Back in October 20, 2020, the CDC published estimates by the National Center for Health Statistics (NCHS) of “299,028 excess deaths from late January through October 3th 2020, with two thirds attributed to COVID-19” (5). This begs the question: How can those results be reconciled with the above conclusions? Because they defined excess deaths as “the number of persons who have died from all causes, in excess of the expected number of deaths for a given place and time” (5), when they state in the discussion part of their paper that they “might underestimate the expected number of deaths”, what they are saying is, they might have overestimated excess deaths. In other words, the model used to produce their excess deaths estimates did not account for the increase in population over the years. In contrast, by using death rates, which are simple statistics anyone who cares to do so can compute, this analysis does account for the increase in population over the years.
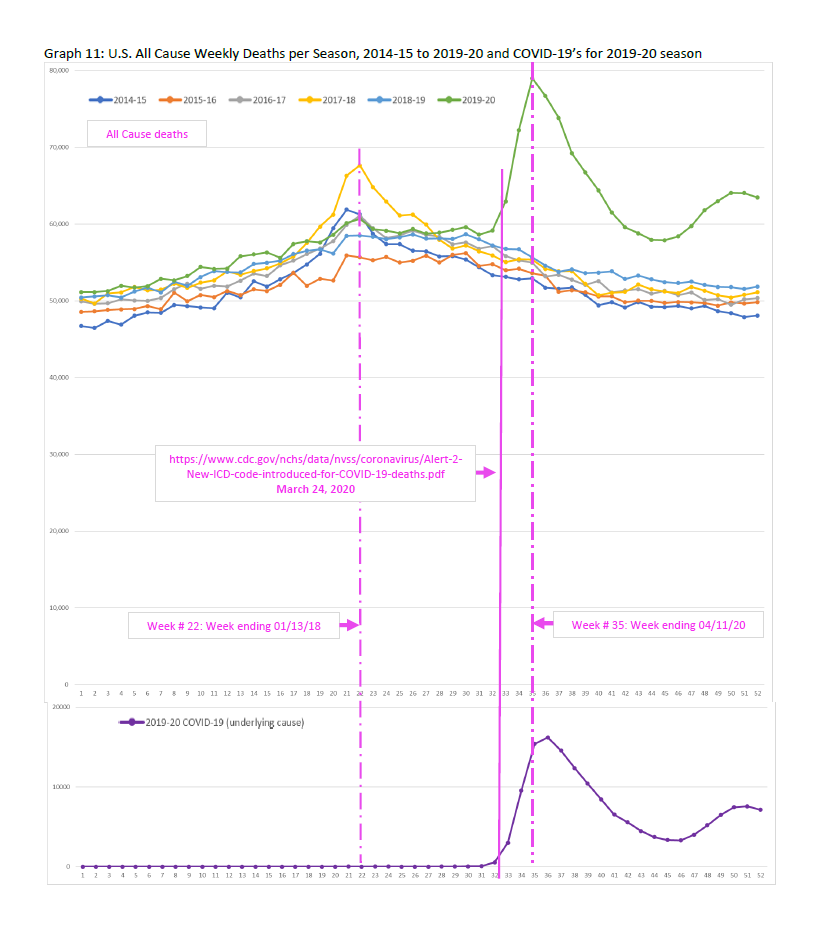
Graph 11 is the plot of the U.S. All Cause weekly deaths per season, from season 2014-15 to season 2019-20. The 2019-20 peak occurred week ending April 11th 2020 (in spring, which is unusual) while the 2018-20 occurred week ending January 13th 2018 (in winter, which is usual). What is most striking though is that the 2019-20 weekly deaths were following the pattern of deaths from previous years, very closely—until March 24.
Do you see that?—very closely, until March 24.
March 24, 2020 is the date a new code was introduced to record COVID-19 deaths (15). Prior to March 24, there was no category or cause of death code devoted to keeping track of deaths due to COVID-19. This was a new virus, so it makes sense there was no code for it, before. Still, other categories or causes of deaths due to respiratory diseases already existed: Chronic lower respiratory diseases, influenza and pneumonia, and other diseases of the respiratory system. The CDC performs a very important task, collecting health and death data. Although new codes and categories need to be introduced, they can make the interpretation of the data collected more difficult—especially if the use of a new code or category of death is heavily incentivized.
Respiratory diseases had previously been classified into one the following three cause of death categories: Chronic lower respiratory diseases, influenza and pneumonia, and other diseases of the respiratory system. The historically low levels of deaths due to these old respiratory diseases points to a reclassification of deaths into the newly and specially introduced respiratory disease category for COVID-19. Level of deaths departing from their historical levels, such as deaths due to non-natural causes (suicides) and natural cause (diabetes) points to mitigation efforts (isolation, lockdowns) being the cause of death, rather than COVID-19 itself.
Graph 15: U.S. Weekly Deaths per Season. Deaths due to symptoms, signs and abnormal clinical and laboratory findings, not elsewhere classified.


External causes of death include accidents, assault (homicides), intentional self-harm (suicides) and injuries of undetermined intent (21). Some will also be updated to various natural causes as well (4).
Could those deaths due to symptoms, signs and abnormal clinical and laboratory findings, not elsewhere classified, reflect the unprecedented state of stress, anxiety, anger, depression, and incomprehension, that the COVID-19 campaigns of fear and isolation has brought on individuals who usually find health, meaning, and thrive, through positive interactions with others?
The U.S. age distribution of deaths did not significantly change following COVID-19. This suggests the reason a higher number of COVID-19 deaths has been reported among older individuals than younger individuals, is simply because, every day in the U.S., COVID-19 or not, those aged 85 or older are at a higher risk of dying than those aged 84 or younger. This should come as no surprise to anyone.
Has any consideration ever been given to the relevance of the national picture and national “solutions”, to state, county, local and individual situations? Or have COVID-19 measures been blindly adopted and applied, top-down, in haste, obsessively and short sightedly? What role did groupthink play into this? Those questions will need to be answered.
A more holistic approach to health seems to be needed to address each individual’s unique circumstances, needs and preferences. Only such an approach can minimize all the suffering and inequities at the individual level, and maximize welfare at the society level. This individual centered approach to health needs not to harm one, for others to benefit. It fosters unity, by being compassionate to all.
Genevieve Briand, Ph.D.
Assistant Director
MS in Applied Economics
Advanced Academic Programs
Johns Hopkins University