The number of deaths from COVID-19 in our nation is of great concern. Looking at the Centers for Disease Control and Prevention (CDC) website in order to decipher the death rates is like decoding impossible encryption. This data, however, was deciphered by Dr. Genevieve Briand, assistant program director of the Applied Economics master’s degree program at Johns Hopkins University in her webinar titled “COVID-19 Deaths: A Look at U.S. Data” on November 11, 2020.
Dr. Briand consolidated the COVID-19 death data from mid-March to mid-September 2020. The data reported shows that by mid-September 2020, the U.S. reached 1.7 million deaths of which over 200,000 were designated COVID-19 related. When Dr. Briand separated the total U.S. deaths in different age groups, the COVID-19 deaths could be better understood. (See the graph below.)
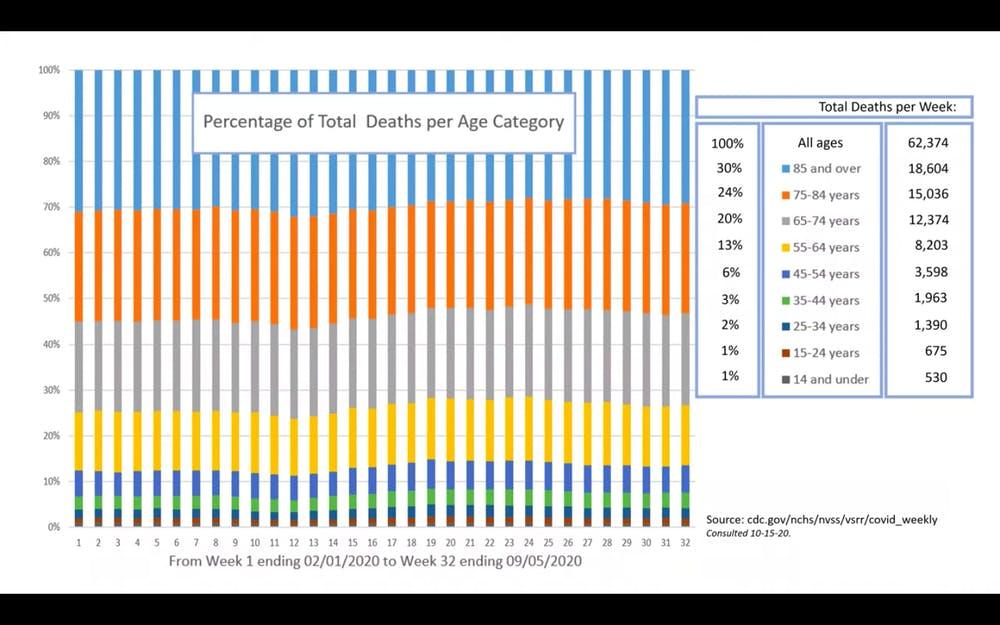
Dr. Briand surprisingly found that in the deaths of all age groups, including the elderly, “the percentage of older people who passed away every week…doesn’t change over the weeks shown here.” The graph shows deaths over 32 weeks, including pre-COVID weeks, indicating the mortality was roughly the same before and after COVID. The data showed that “50,000 to 70,000 deaths per week in the United States is normal. It is to be expected. Individuals in every age group pass away every week. …We don’t like to say it is normal, but it is.”
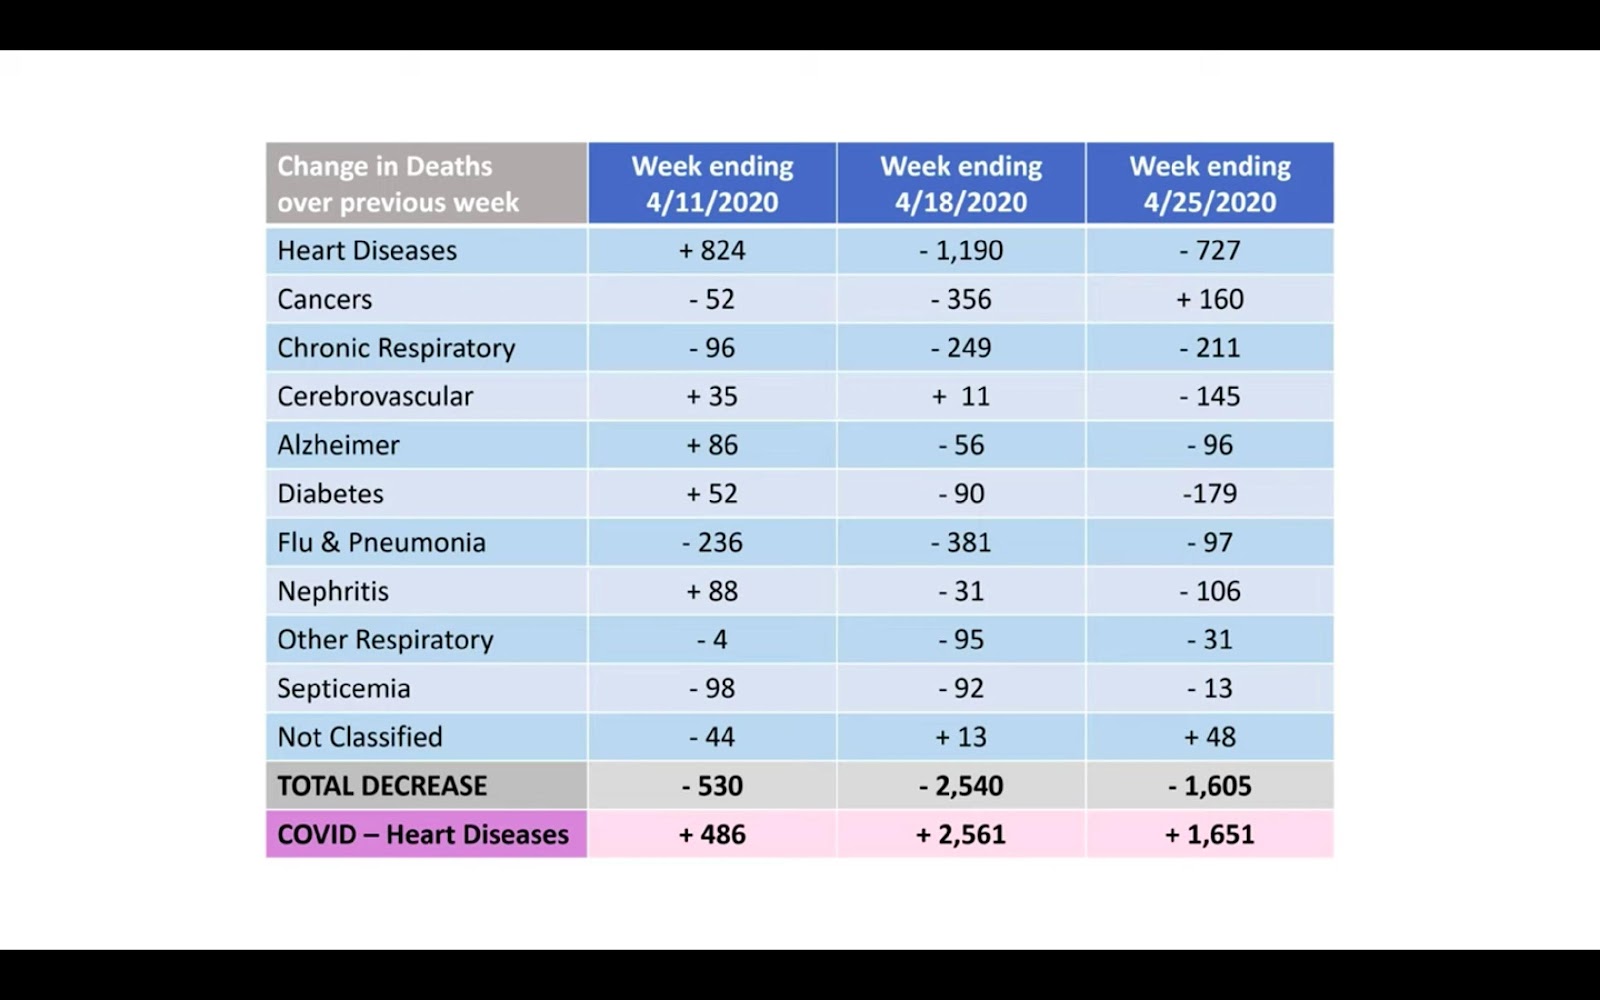
Recently, there has been a sudden increase in deaths, which Dr. Briand explains is likely due to a normal seasonal increase in deaths from all causes, but most frequently noted in past years to be from heart and lung diseases, flu, and pneumonia.
The table below demonstrates the decrease in deaths by these other causes, which is almost the same figure as the increase in deaths by COVID-19. (The decrease in deaths due to heart and lung disease is contrary to the pattern seen in previous years.)
Dr. Briand suggests an explanation: the deaths we can expect in a normal year from “heart diseases, respiratory diseases, influenza and pneumonia” are now being labeled as deaths from COVID-19.
The CDC labels all deaths in which a patient has tested positive for COVID-19 as “COVID-19 deaths.” Patients who died from other conditions, but tested positive for COVID-19, are still considered a COVID-19 death—which is likely why the number of COVID-19 deaths has increased, but deaths from other diseases have decreased.
Thus, the COVID-19 death toll is misleading.
Both the graph and table above show the lack of excess deaths from COVID-19 since the total deaths in the United States appears relatively unchanged.
As more data is collected, researchers such as Dr. Briand can help us accurately interpret the actual toll of COVID-19 deaths in the U.S.
*Graphs and tables used with permission from Dr. Genevieve Briand
Full Presenation: COVID-19 Deaths, A look at US Data